You're Richer in Bitcoin Than You Think — The Math Behind Bitcoin's Wealth Distribution
Wesley · March 23, 2026 · 5 min read
You've probably seen the stat: the top 1% of Bitcoin addresses own 87% of all Bitcoin. Sounds like the same old wealth inequality story, just with a different currency. But that conclusion is wrong — and publicly available on-chain data proves it.
The Misleading "1% Own Everything" Narrative
There are roughly 58 million Bitcoin addresses with a balance right now. Here's how the distribution actually breaks down:
- 92% of addresses hold less than 0.1 BTC — together owning just under 2% of total supply
- ~3.5 million addresses hold between 0.1 and 1 BTC (6% of addresses, 5.3% of supply)
- ~824,000 addresses hold 1 BTC or more (only 1.4% of all addresses)
- ~131,000 addresses hold 10–100 BTC (21% of supply)
- ~18,000 addresses hold 100–1,000 BTC (about 25% of supply)
- ~2,000 addresses hold 1,000–10,000 BTC (21% of supply)
- Just 4 addresses hold over 100,000 BTC each — over 800,000 BTC combined (~3.3% of supply)
Data source: BitInfoCharts Bitcoin Rich List
Addresses Aren't People
Here's the part the headlines miss. Who actually holds those top addresses?
- Strategy (formerly MicroStrategy): Over 717,000 BTC — a publicly traded company with thousands of shareholders
- BlackRock's iShares Bitcoin ETF (IBIT): Over 590,000 BTC — held on behalf of millions of individual investors, retirement accounts, and pension funds
- Binance cold wallets: Multiple entries in the top 100 — an exchange holding Bitcoin for over 100 million users globally
- UK Government: ~36,000 BTC in confiscated assets (seized, not personal wealth)
Saying "one address holds that much Bitcoin" is like saying one building in Manhattan owns more wealth than the entire state of Wyoming. Technically true at the address level, but that single Coinbase wallet represents over 100 million individual people.
The Gini Coefficient Tells the Real Story
Economists measure inequality using the Gini coefficient — a scale from 0 (perfect equality) to 1 (one person has everything).
Bitcoin naturally started at a coefficient of 1 in 2009 when Satoshi mined the first block. Since then, it has been steadily declining. Every cycle, Bitcoin gets distributed to more people, more wallets, more institutions, more countries.
Meanwhile, the U.S. dollar's Gini coefficient for American wealth has been trending upward for 50 years — getting more concentrated and more unequal every decade.
Bitcoin is distributing. The dollar is concentrating.
The Cantillon Effect vs. Bitcoin Mining
In the traditional financial system, new money enters through banks and the Federal Reserve. Banks get it first. Their biggest clients get access next. Wall Street firms use it to buy assets. By the time new money reaches your paycheck, its purchasing power has already been diluted.
This is the Cantillon Effect — those closest to the money printer benefit the most. Everyone else gets inflation.
Bitcoin flips this entirely:
- New BTC enters through mining — anyone, anywhere can mine
- No permission needed, no Goldman Sachs connections required
- The issuance rate is fixed and decreasing (halving every ~4 years)
- No chairman can decide to print more
- A teenager in El Salvador and a hedge fund in New York play by the exact same rules
The On-Chain Evidence
The data shows distribution improving over time:
- 2011: Top 100 addresses held roughly a third of all Bitcoin
- 2026: Top 100 addresses hold about 14%
Supply didn't disappear — it spread to millions of new users.
- 2013: A few hundred thousand Bitcoin users
- 2017: A few million
- 2021: Over 100 million
- 2026: Nearly half a billion people worldwide own some Bitcoin
The "whole coiner" count (addresses holding 1+ BTC) has nearly doubled from ~460,000 in 2015 to ~824,000 today — despite the price going from $300 to over $100,000.
Where Do You Fall?
Here's where you stand based on real on-chain data:
| Your Holdings | Your Ranking |
|---|---|
| Any Bitcoin at all | Top 1.3% of world population (~500M of 8B people) |
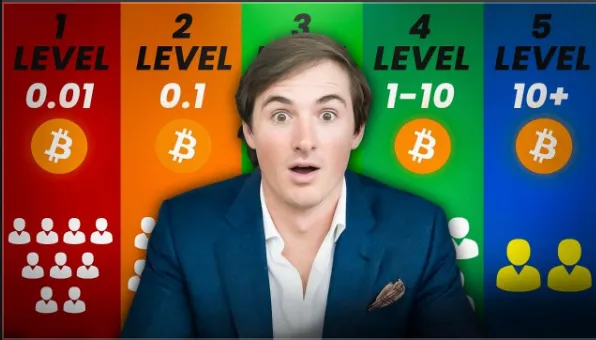
| 0.01 BTC (~$700) | Ahead of 60% of all Bitcoin addresses |
| 1 BTC | Top 7.5% of all Bitcoin addresses (only ~3.5M addresses) |
| 10+ BTC | Top 0.26% of all addresses (~131,000 addresses) |
Consider this: there are more millionaires in America alone than there are whole Bitcoins. If every American millionaire wanted just one Bitcoin, they couldn't all have one.
The Scarcity Math
Of the 21 million Bitcoin that will ever exist, an estimated 3–4 million are permanently lost (lost keys, hard drives in landfills, owners who passed without sharing seed phrases). That leaves roughly 16–17 million BTC in actual circulation.
Divide that by 8 billion people: your per-capita share is about 0.002 BTC (200,000 sats) — around $140 at today's prices.
If you own more than $140 worth of Bitcoin, you already hold more than your mathematical share of the global supply.
The Bigger Picture
With a fixed supply and growing adoption, every fraction of Bitcoin you hold becomes a larger relative share of the shrinking available pool. The traditional financial system concentrates wealth through inflation, access, and proximity to power. Bitcoin distributes wealth through open access and fixed supply.
The Gini coefficient proves it. The on-chain distribution proves it. And the trend is clear: Bitcoin is not becoming more concentrated over time — it's becoming more distributed.
Based on a video by Wesley Schlmer, founder of Bitcoin Bay, the first Bitcoin meetup nonprofit in the country.
Sources: BitInfoCharts Rich List, Investopedia — Cantillon Effect, on-chain Bitcoin data